
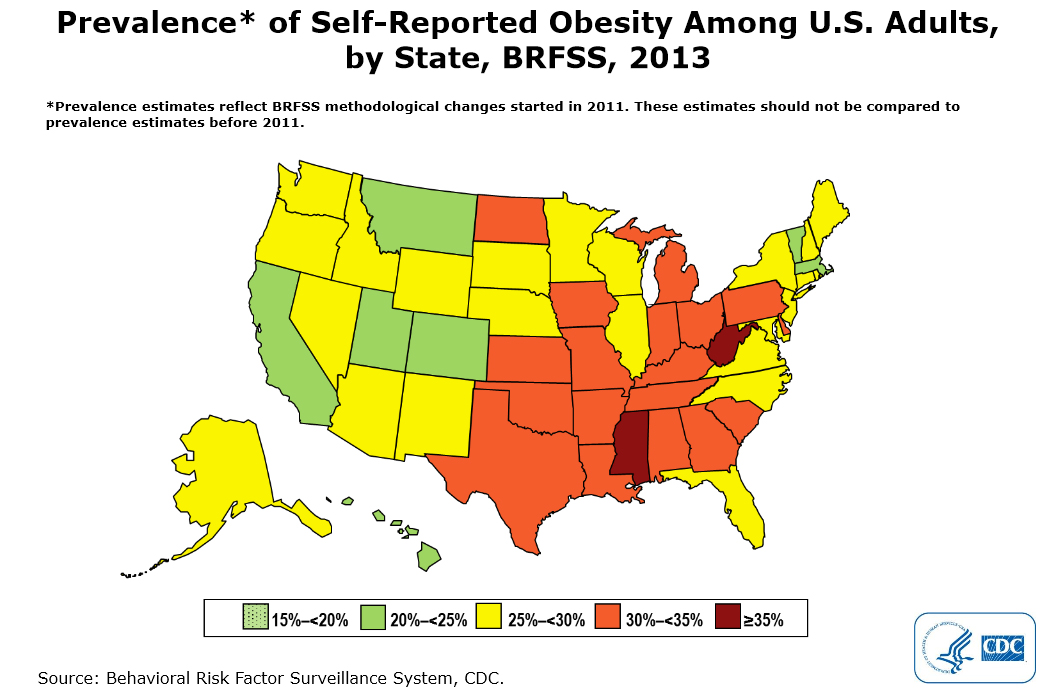
Just released: The latest CDC maps showing prevalence of obesity across the US.
- No state had a prevalence of obesity less than 20%.
- The South had the highest prevalence of obesity (30.2%), followed by the Midwest (30.1%), the Northeast (26.5%), and the West (24.9%).
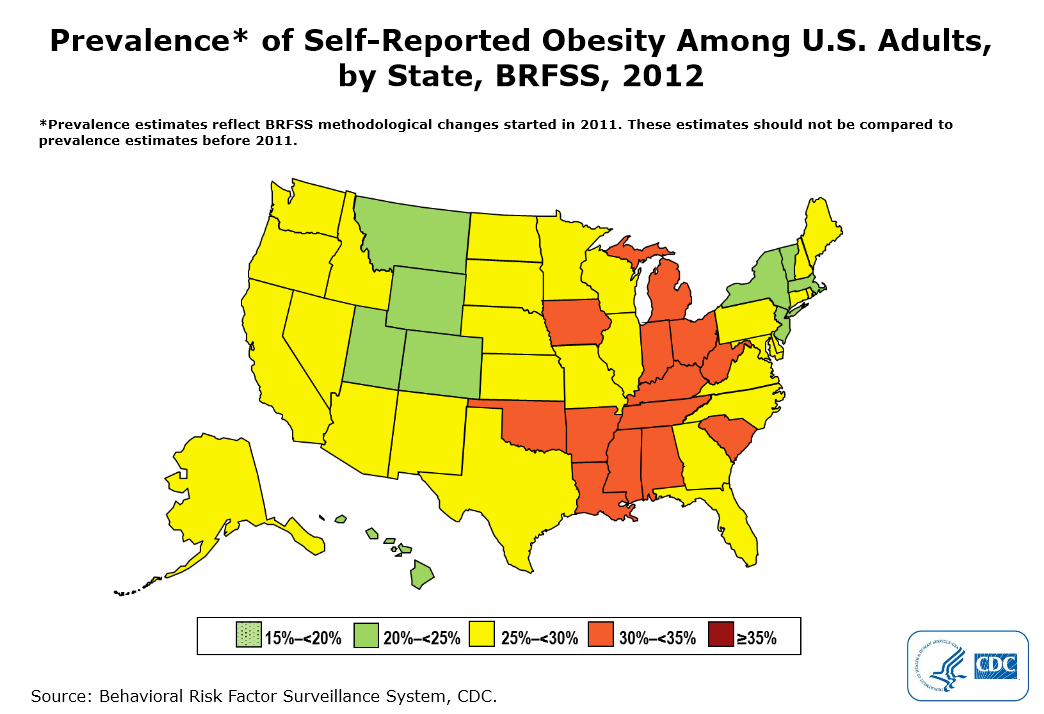
Here’s what it was the year before:
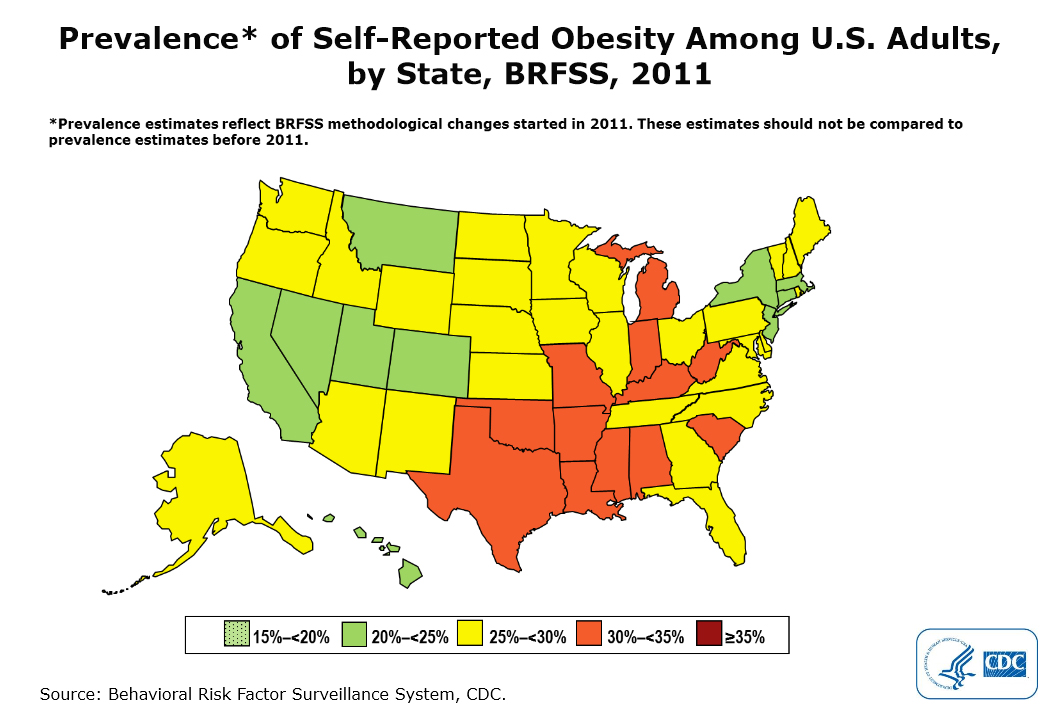
And the year before that:
These are self-reported numbers. If we could measure people’s weights, do you think they would they be higher or lower than what they say?
