
Anrosh saying we eat more meat than we used to reminded me of this post from 2008. We did eat a lot less meat 100 years ago. We ate a lot less fat and a lot more grain too. All of those, according to the low-carb contingent, should have conspired to make us fatter and give us higher rates of diabetes back then. In fact, we weighed less and had lower rates of diabetes a hundred years ago … eating that lower-fat, higher-carbohydrate diet.
________
 The USDA Economic Research Service (ERS) recently updated their three data sets on food availability in the US:
Food Availability (Per Capita) Data System
Food availability doesn’t equate directly to food consumption; spoilage and waste aren’t accounted for. One of the data sets, Loss-Adjusted Food Availability, “adjusts aggregate food availability data for nonedible food parts and food lost through spoilage, plate waste, and other losses in the home and marketing system.” It accounts for some loss but only goes back to 1970, that I can tell.
I can’t determine how or if they accounted for food produced by a consumer instead of by a marketing entity. That is, if you’re eating eggs from your hens or carrots from your garden, are they accounted for in these data sets?
Still, as a proxy for consumption, they’re revealing.
So, did we eat more meat 100 years ago than we do today? (Click graphs for larger.)
 Grain:
 Fats and oils:
 This one shows just oat products. What’s that blip between 1988 to about 1995?
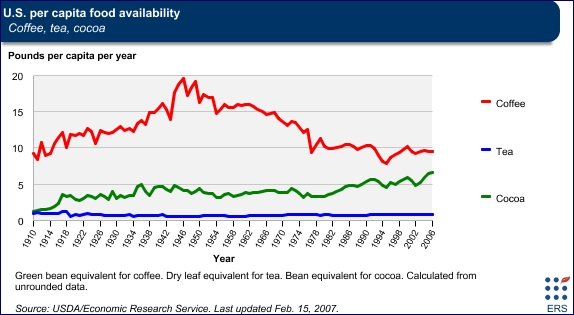
 A couple beverage graphs … First, coffee/tea/cocoa. Imagine if Starbucks was around in the 40s? (When I was growing up, everyone drank hot coffee with breakfast. I see a lot more carbonated beverages these days.)
 Is America more a wine- or beer-drinking country?
a href=”https://fanaticcook.com/wp-content/uploads/2014/10/foodavailabilitywinebeer.jpg” target=”_blank”>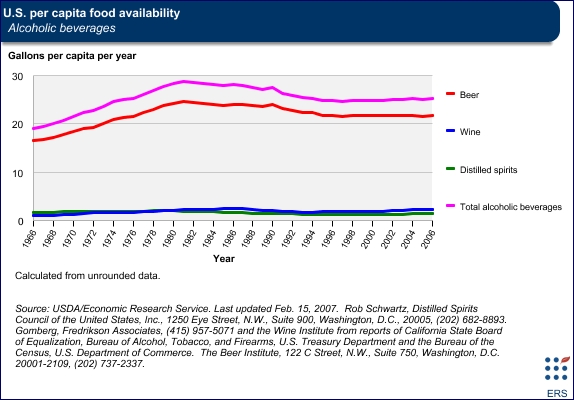 Using data in their Loss-Adjusted Food Availability Set, I generated this graph for calorie consumption. We’re eating (or what is available for us to eat) 519 more calories a day (24% more) than we did in 1970.
 You can easily generate these charts on their site. The raw data is accessible in Excel worksheets. It’s what I used for the calorie graph. I could play with this all day.
________ The photo at the top is of a kitchen classroom in a housekeeping flat, New York, circa 1910, from Shorpy. Here’s another: “December 1936. Farmer’s wife churning butter. Emmet County, Iowa.” (Click for larger. Note that bowl of eggs! Given the appliances and the storage space, both of these images represent more well-to-do families at the time.)

Our plates , cups and glasses have gone bigger !
The furniture has grown bigger – the chairs , the sofas
The sizes of storage boxes and closets have grown bigger
Does that say something ?
And our brains ? – That would be an interesting study !
LikeLike